Lab 1
Lab 1A: The Artemis Board
The purpose of this lab was to set up and become more familiar with Arduino IDE and the Artemis board. The Sparkfun Artemis nano will be used throughout the whole semester, so it is important that it is compatible with my computer and I understand how to use it.
Prelab
Before beginning the lab, I installed ArduinoIDE and Sparkfun Apollo3 boards manager onto my computer.
Task 1: Hook Artemis Board up to Computer
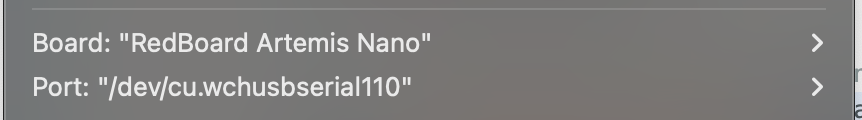
After updating my Arduino and installing the Sparkfun Appollo3 boards manager I was able to select the correct Board. I had to download the CH340 Driver, but once I did I was able to select the correct Port.
Task 2: Blink
As seen in the video linked below, an LED on the the Artemis board can be programmed to blink at constant intervals.
Task 3: Serial
The video linked below shows the Serial Monitor output of Example4_Serial. Running this script was essential, as the Serial Monitor will be a very helpful tool throughout the course. I had to change the baud rate to 115200 in order to make sure I was seeing the correct output.
Task 4: Temperature Sensor
The video below shows the output of Example2_analogRead in the Serial monitor. Focusing in on the temperature measurements, the values outputted by the sensor increase slightly when I enclose my hand around the Artemis board. The temperature increases from around 33100 to 33200.
Task 5: Microphone
As seen in the video linked below, the Artemis board microphone responds to the sound of my voice. The frequency is zero when no noise is detected. Then, it increases to around 500 Hz as I begin to speak. Then, when I whistle, the frequency increases significantly to 2000 Hz. When I stop whistling, the frequency drops back to zero.
Additional Tasks for 5000-Level
1. Blink when you hear “C”
The goal of this task was to make the Artemis board blink when it heard the note “C” played. First, using the MicrophoneOutput script, I found that the frequency at which the board detected a “C4” note was 263 Hz. Using this information, I was able to combine the MicrophoneOutput and Blink scripts such that when the Artemis detected a frequency greater 260 and less than 265 the LED would turn on. When it no longer heard sound in this frequency, it turned off. See the video below for a demonstration.
Lab 2A: Bluetooth
The purpose of this lab was to test Bluetooth by learning how to use Jupyter lab notebooks in conjunction with the Arduino IDE to communicate with the Artemis board.
Prelab
Before beginning the lab, I read over the BLE summary. I then reinstalled Python 3 because I had version 3.8, and I needed at least 3.10. I created a project directory, which is where I will keep all of my files for this course. Using the terminal, I then created a virtual environment within this project directory. Once this environment was activated, I installed the necessary packages. Next, I downloaded the codebase into my project directory. Using the activated virtual environment, I opened Jupyter notebook and read through the codebase. To get the MAC address of the Artemis, I burned ble_arduino.ino onto the Artemis and changed the baud rate to 115200 bps.

Finally, I read through the Bluetooth Library Limitations and the Processing Commands.
Configuration
Using the MAC address found during the prelab, I updated the MAC address on the computer in connections.yaml. Then, using Juypter notebook, I was able to generate a new UUID.
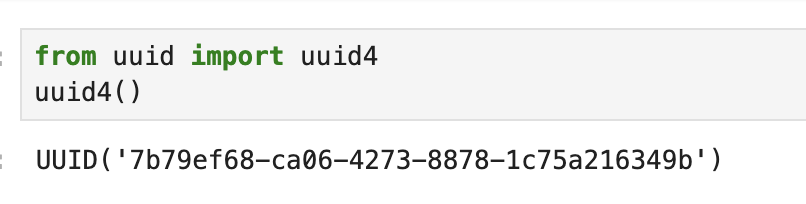
I used this generated UUID to replace the UUIDs in both ble_arduino.ino and connections.yaml. I also verified that the enum CommandTypes in Arduino were the same as the defined types in cmd_types.py. Finally, I was able to reupload ble_arduino.ino to the Artemis to begin working on the tasks.
Task 1: ECHO Command
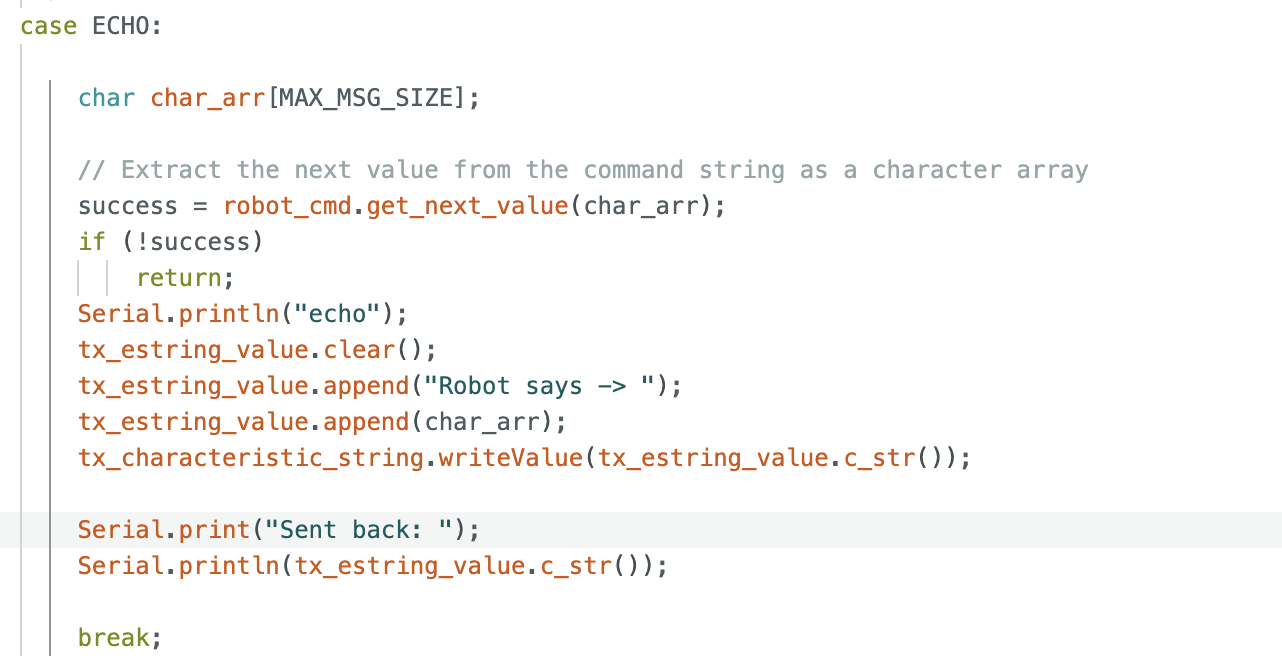
First, I completed the ECHO command in Arduino IDE. This command can be seen below.
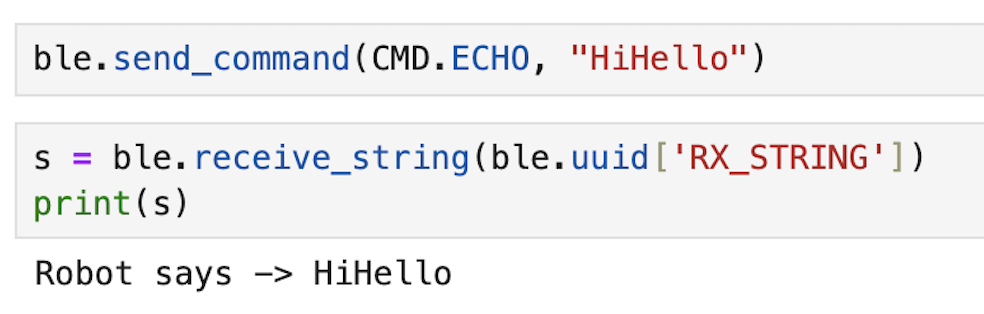
I then called the command in Jupyter, using the code shown below. The command sends the robot “HiHello” and the robot returns “Robot says -> HiHello.”
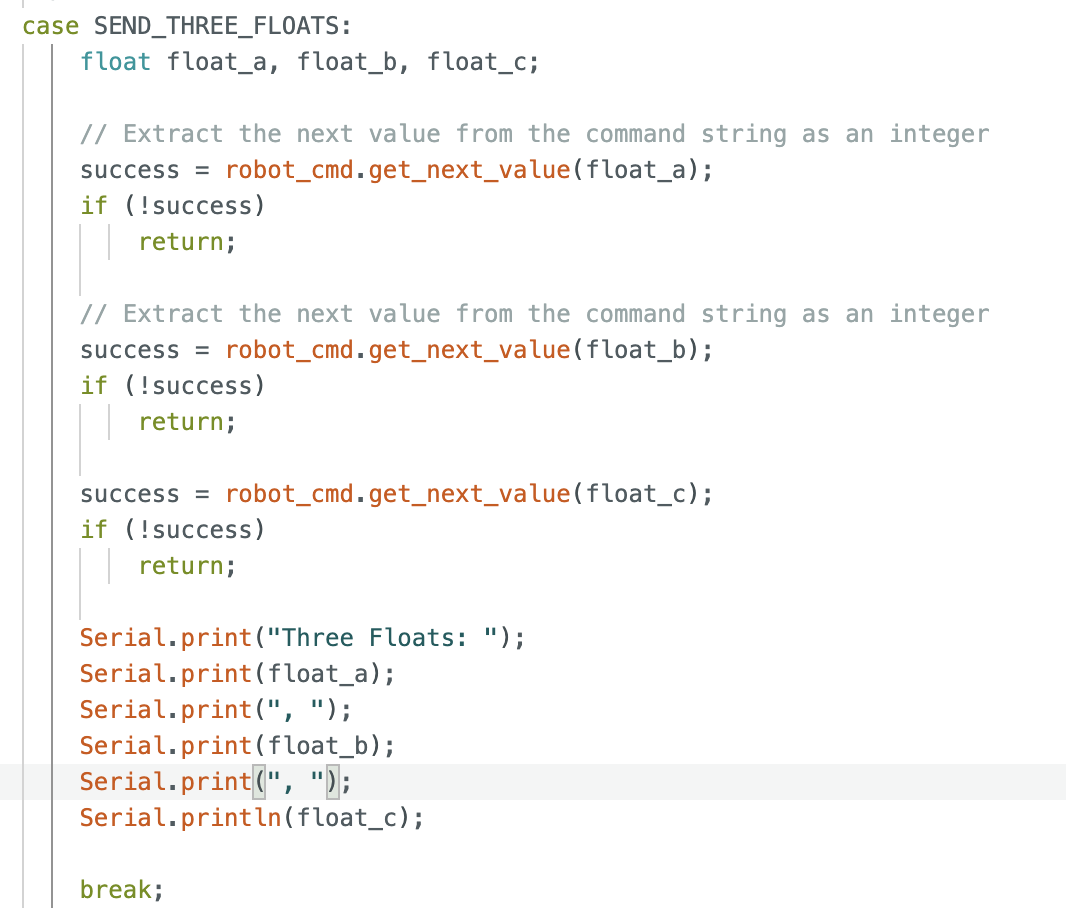
Task 2: SEND_THREE_FLOATS Command
As with the ECHO command, in order to implement SEND_THREE_FLOATS, I first had to write the necessary code to perform the desired task in Arduino. This code can be seen below.
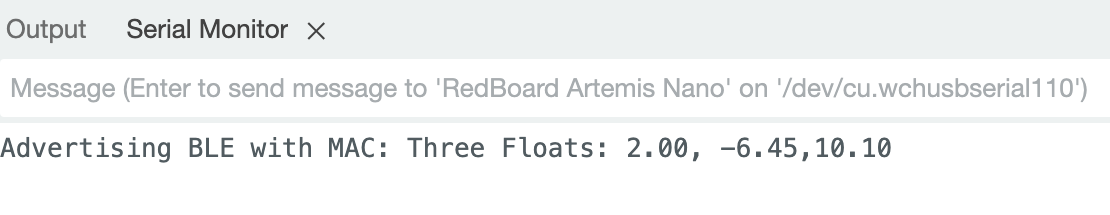
I then called SEND_THREE_FLOATS using the Jupyter Notebook code shown in the image below.

This prompted the Artemis to output the floats to the Serial Monitor.
Task 3: GET_TIME_MILLIS
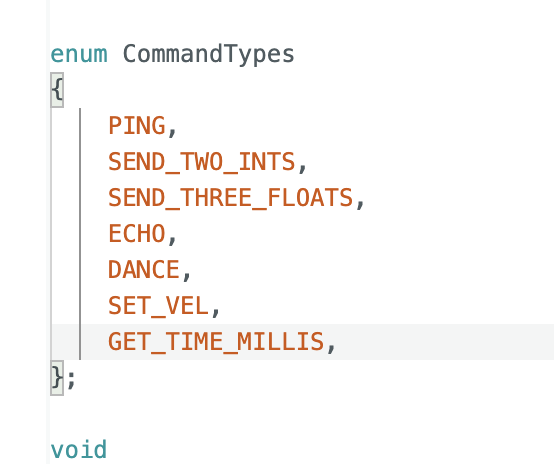
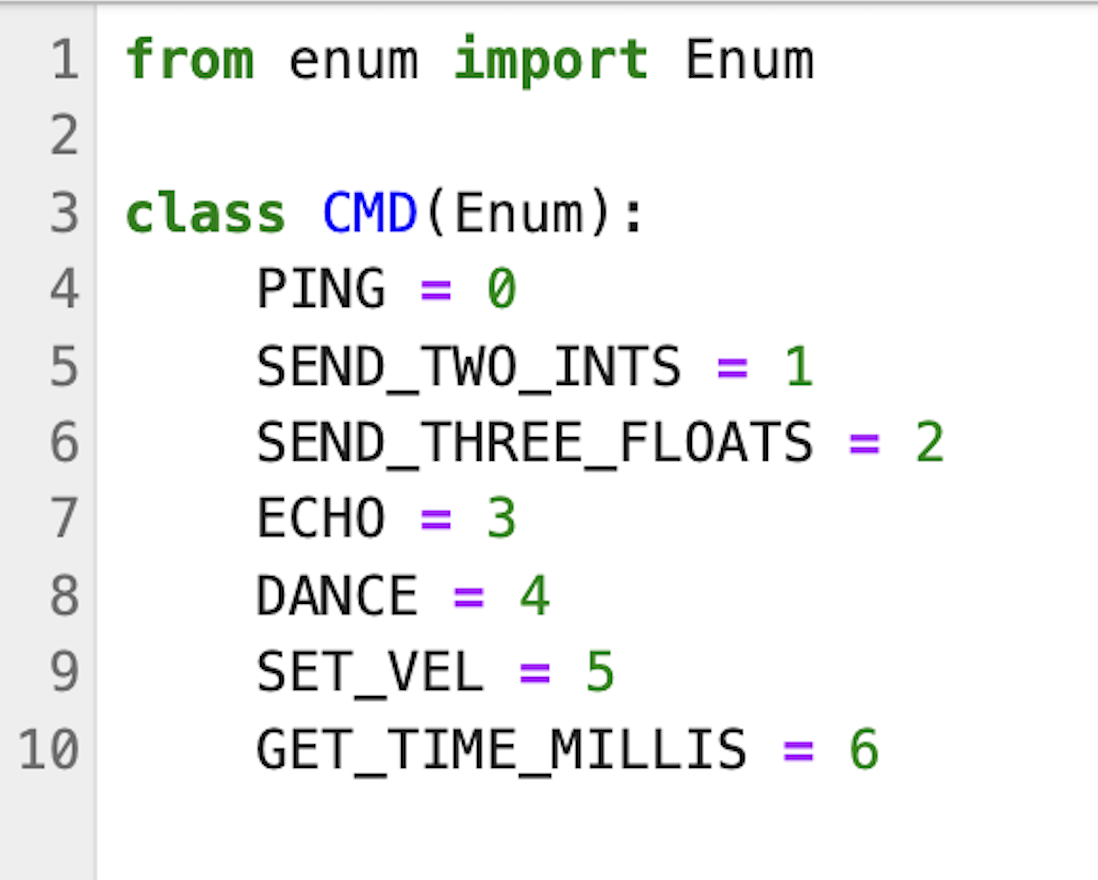
As with the first two tasks, GET_TIME_MILLIS needed to be implemented in Arduino. Unlike before, the GET_TIME_MILLIS did not exist in either Arduino or in Jupyter lab. In order to create the command, it first had to be added to enum CommandTypes in Arduino and cmd_types.py, as seen below. I repeated this process when creating commands in Arduino for tasks 4-7.
After the command names were updated, I was able to create the GET_TIME_MILLIS in Arduino IDE.
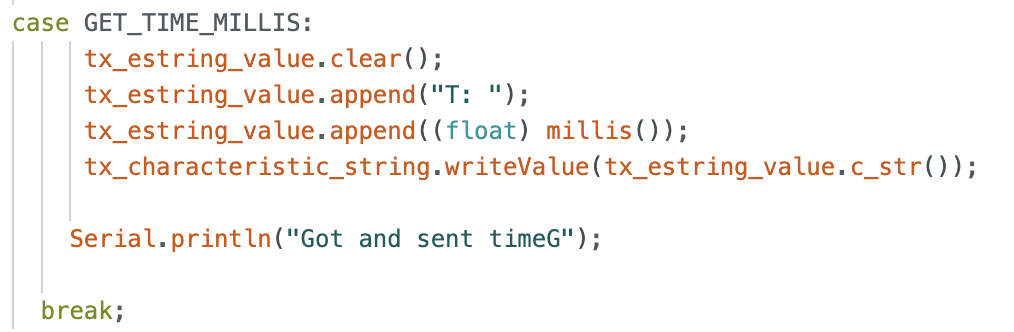
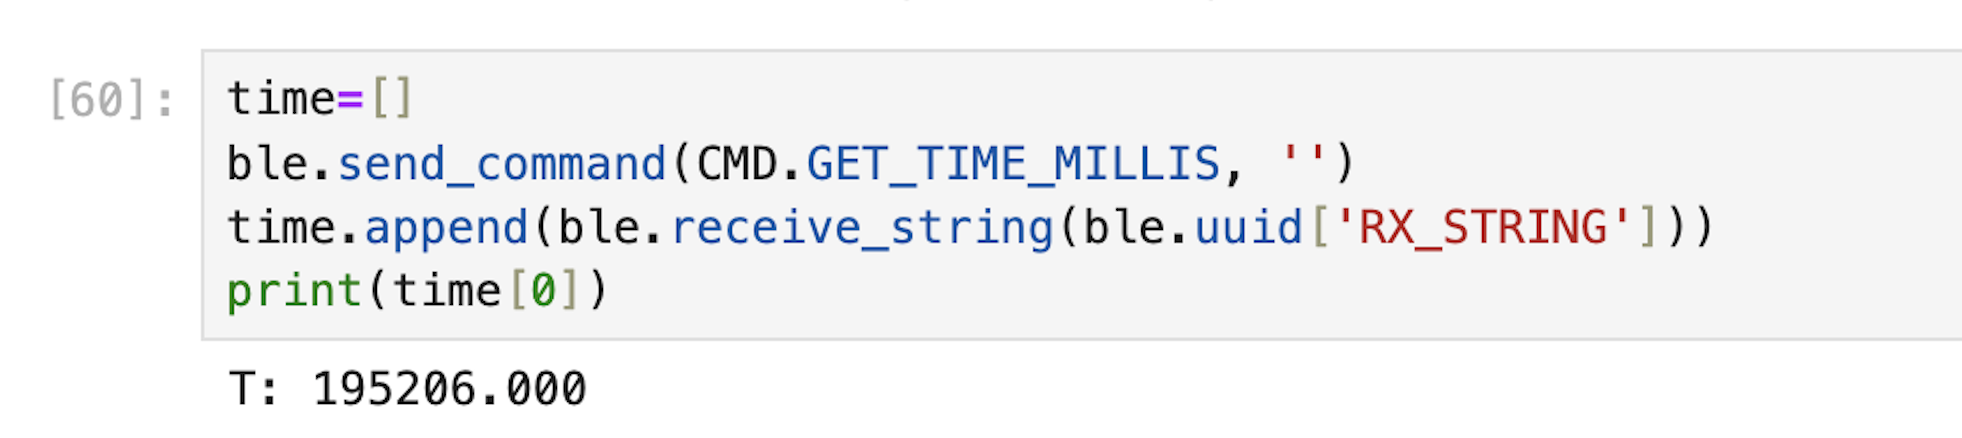
Then, the following python code was implemented in Jupyter Notebook to obtain the time in milliseconds from the Arduino in the format of “T: “ followed by 6 digits.
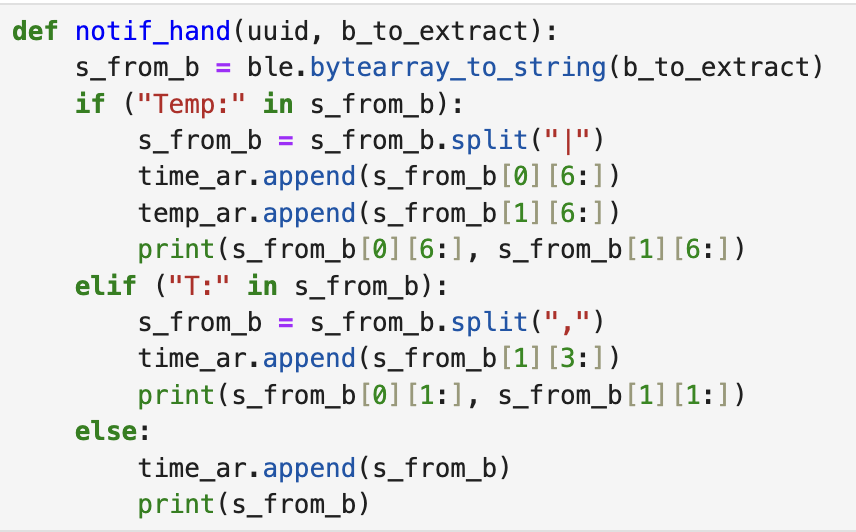
Task 4: Notification Handler
In order to extract time from the string value sent by the Artemis board, I set up a notification handler. The notification handler, shown below, is able to handle three different cases. These cases include different formatting of the timestamp data as well as the addition of temperature data. These three cases pertain to tasks 5, 6, and 7, respectively. Therefore, the notification manager can be used properly for all three tasks.
Task 5: Data Transfer via Loop Method
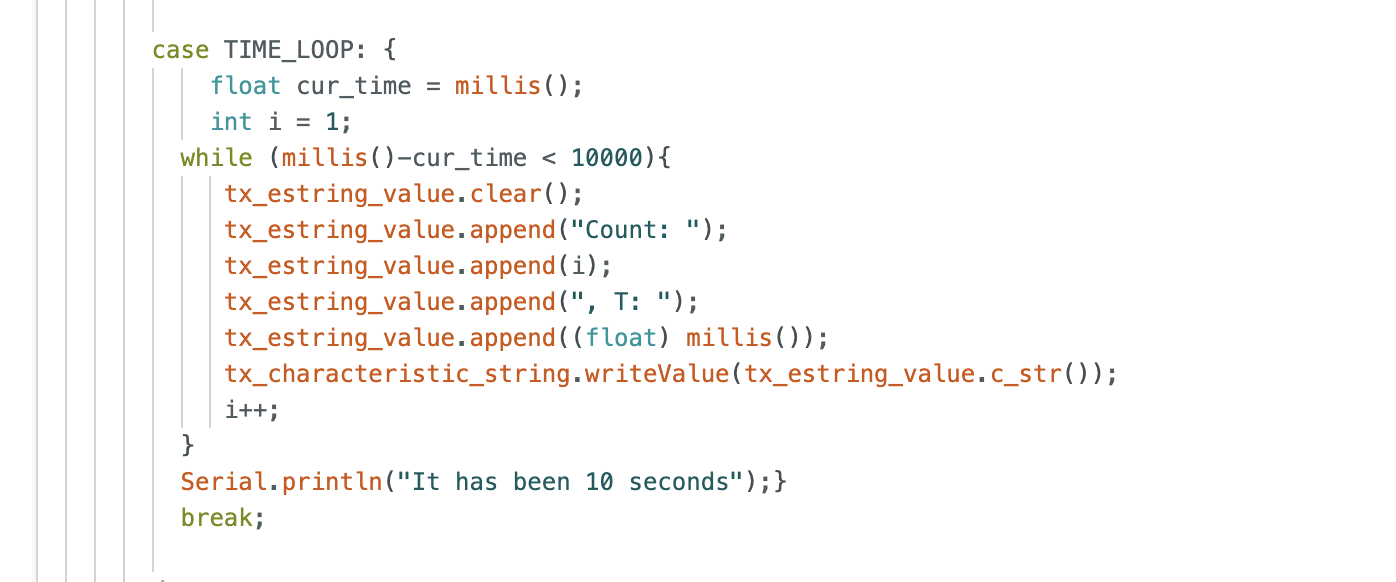
To test the effective data transfer rate of Bluetooth communication between my computer and the Artemis board, I created a loop in Arduino that obtained the time in milliseconds and then sent it to Jupyter Lab on my computer. Once called, the loop ran for 10 seconds. In addition to recording the time, I kept track of how many times the loop ran during the 10 seconds. This “count” was sent to computer along with the time in milliseconds to more easily calculate the average effective data transfer rate over 10 seconds. The code is shown below.
The notification handler was responsible for receiving and processing the time sent to the computer by the Artemis board. It separated time and count values, placing time values into an array. In order to better visualize the data being sent from the Artemis board, the notification handler printed both count and time in milliseconds. The beginning and end of a sample output can be seen below.
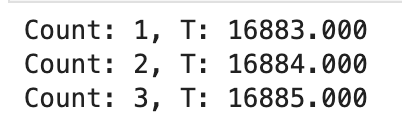
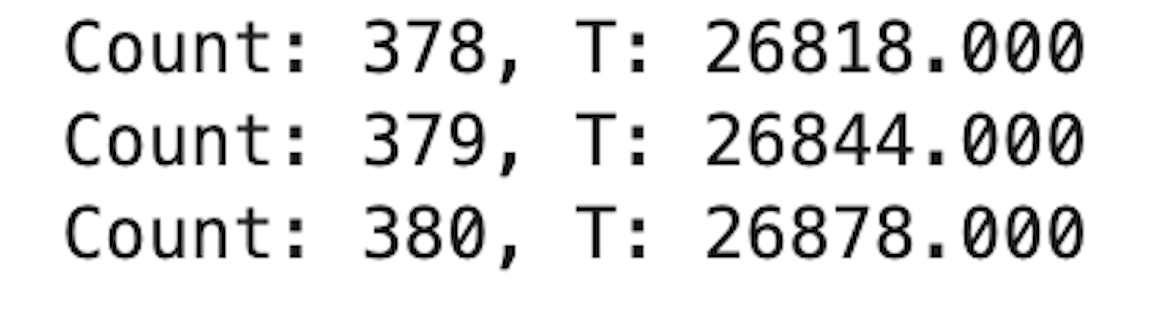
Since approximately 380 time values were transferred from the Artemis board to my computer within 10 seconds, the effective data transfer rate using this method is 38 values per second on average.
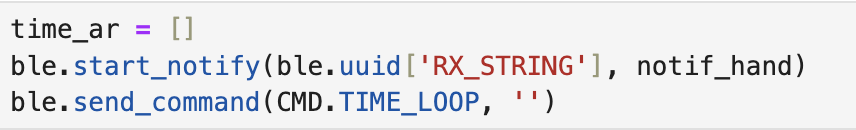
Finally, the code that was called in Jupyter notebook to activate the notification handler and the time loop can be seen below.
Task 6: Data Transfer via Array Method
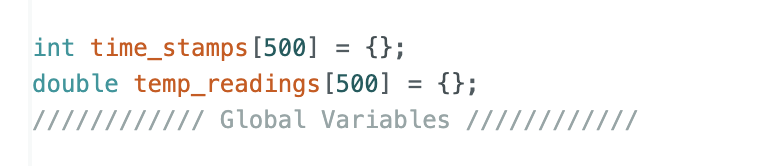
As above in task 5, the purpose of this task is to send timestamps from the Artemis board to my computer. However, to improve efficiency, each time stamp was placed into an array in Arduino. This array, along with the temperature array used in task 7, had to be defined globally to allow them to be accessed outside of the loop command. I decided to give the arrays a length of 500 because I needed them to be large enough to see a difference in timestamps to determine efficiency. However, they could not be too large, or that would be a waste of storage.
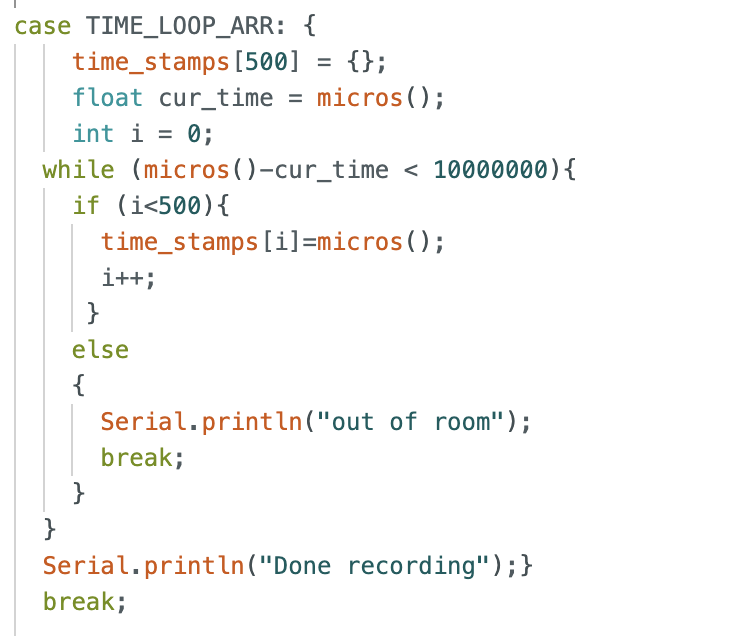
Creating these arrays allowed all the values entire array to be sent back at once, instead of one value at a time. I created a command, TIME_LOOP_ARR, in Arduino to add the timestamp values to the timestamp array. I recorded the time values in microseconds instead of milliseconds because I wanted greater accuracy when calculating the rate of data transfer for this method.
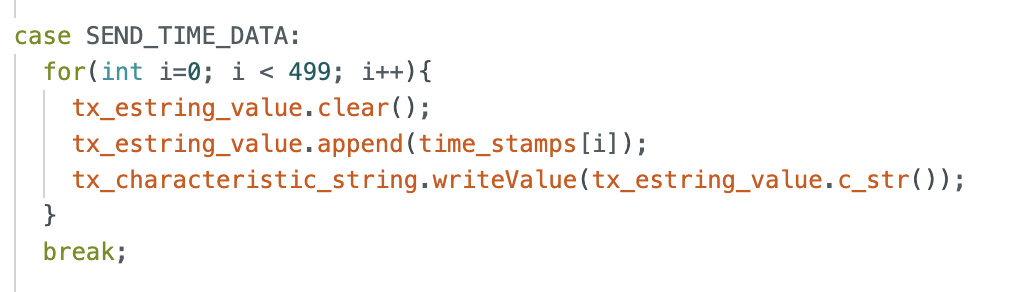
Then, I created the SEND_TIME_DATA command which looped over the timestamp array to send the timestamps to the computer.
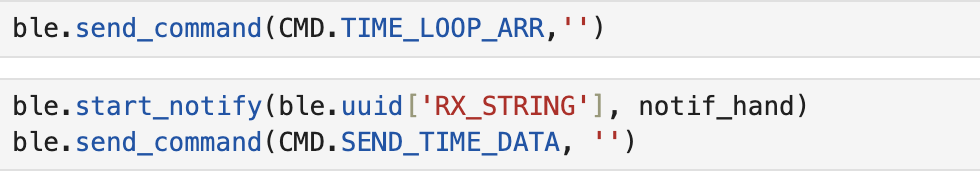
The Jupyter notebook code used to call the commands and activate the notification handler can be seen below. The loop command was called first to generate the array, and then the notification handler was activated in order to properly receive and process the timestamps sent to the computer.
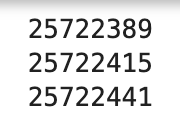
The beginning and end of a sample output can be seen below. This method was much more efficient, as 500 timestamps were recorded in only 15142 microseconds or 0.0151 seconds. Therefore, the effective data transfer rate using this method was found to be 33,000 values per second on average.
Task 7: Adding Temperature Readings
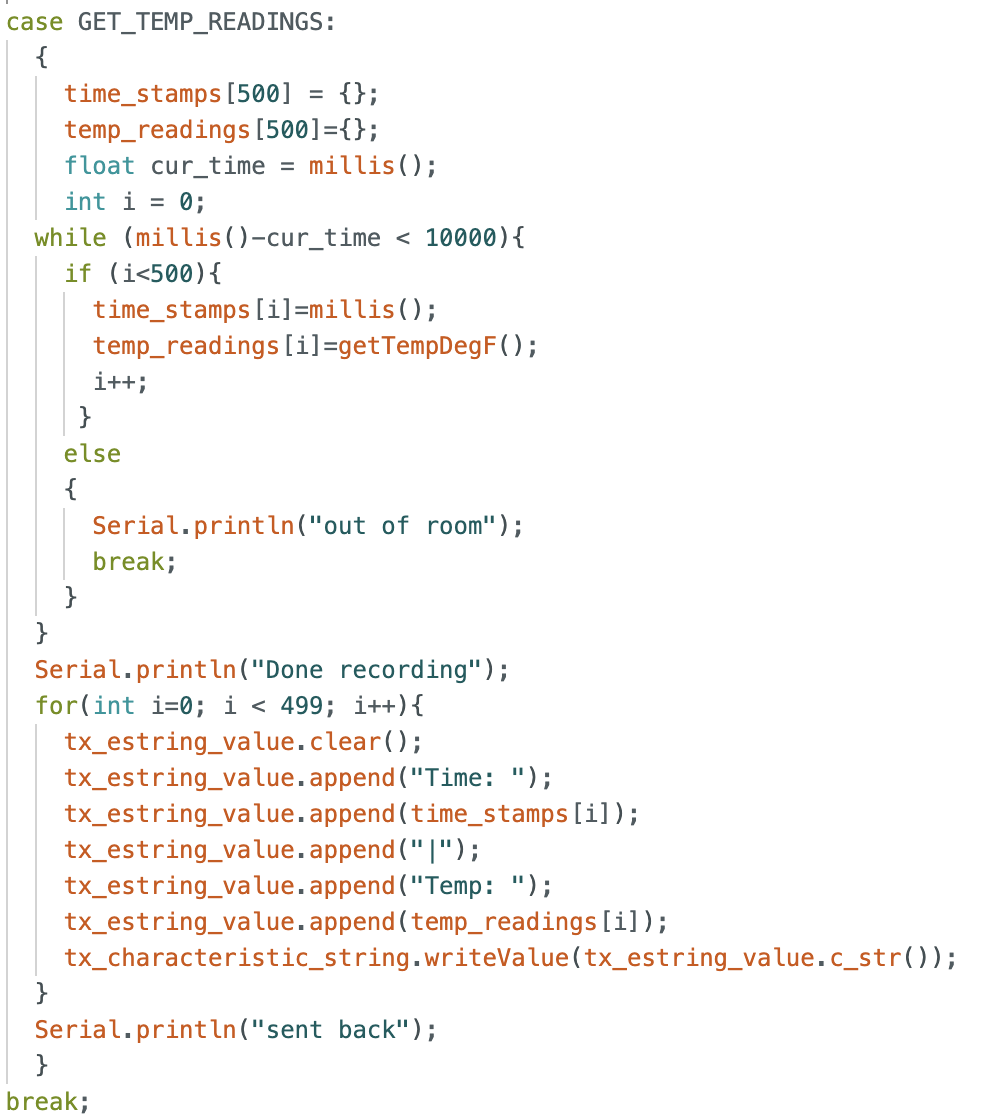
It is possible for the Artemis board to record temperature values with their timestamps. In order to do this, I created the GET_TEMP_READINGS command, seen below, which acted similarly to TIME_LOOP_ARR and SEND_TIME_DATA from task 6, except it also recorded temperature values and placed them in their corresponding array. Once all values were recorded, the temperature values were sent back on the same string as their corresponding timestamp.
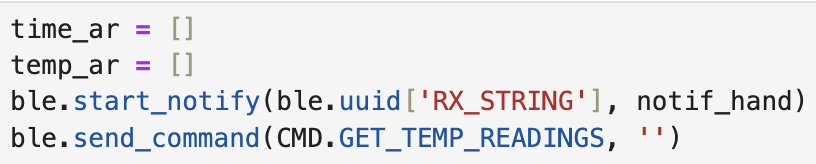
The Jupyter notebook code below initialized time and temperature arrays, initialized the notification handler to receive and process the incoming data, and called the GET_TEMP_READINGS command.
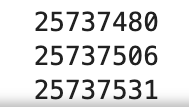
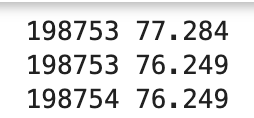
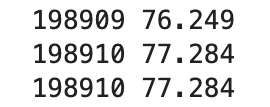
The beginning and end of sample time and temperature values after processing by the notification handler can be seen below.
8: Discuss Difference between Methods
DISCUSS
Additional Tasks for 5000-Level
1. Effective Data Rate and Overhead
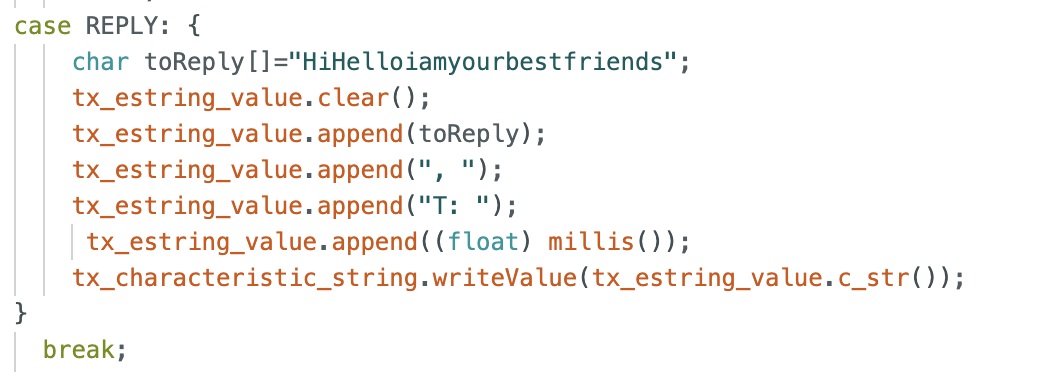
In order to investigate effective data rate and overhead for varying byte sizes, I first made a REPLY command in Arduino. This command would return a char array when prompted by the computer as well as its corresponding timestamp. The length of the char array could be changed between trials in order to vary the byte size since one char character is equivalent to one byte. So, for example, toReply[] shown in the code below is 25 bytes.
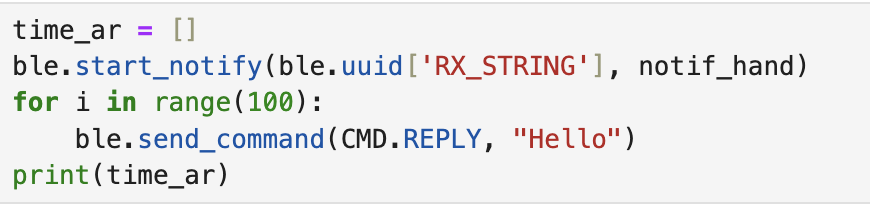
I created a loop in Jupyter notebook that would call REPLY 100 times. This made it easier to find the data rate, as I could average over 100 samples. The notification handler was also activated to receive and process the timestamps sent by the Artemis board. The code can be seen below.
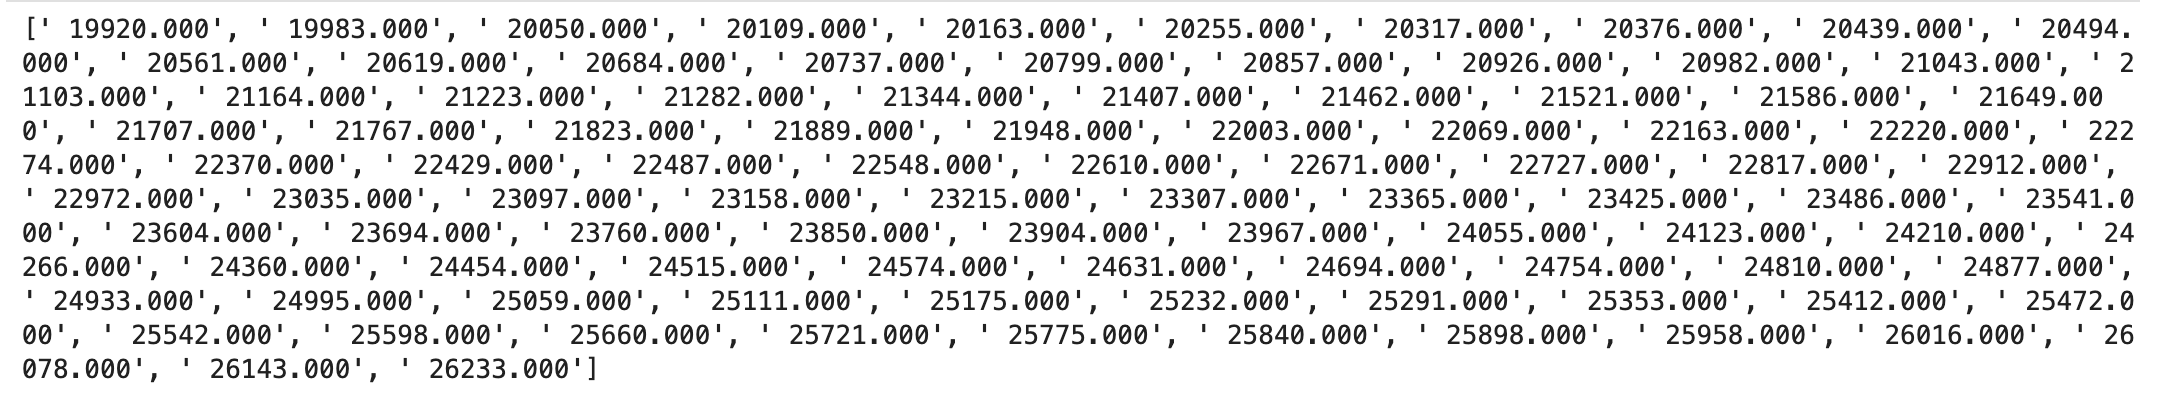
An example of the timestamps printed for a 25-byte reply can be seen below.
After testing a variety of size replies, I was able to create the following graph that relates reply size to data rate:
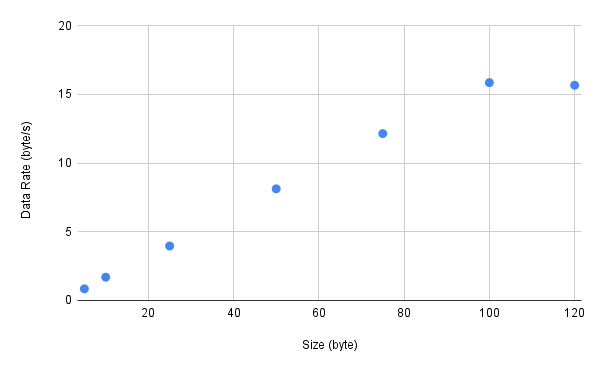
As demonstrated by these results, shorter packets do appear to introduce more overhead than larger packages. Howevever, there seems to be a limit to this trend. The data rate increases with reply size up until around 100 bytes. The data rate levels off between 100 and 120, decreasing very slightly. This indicates that although larger replies can be used to reduce overhead, there is a limit to the ideal reply size.
2. Reliability
When data is sent from the Artemis at a higher baud rate, the likelihood that the computer may miss something is higher. This is because there is a trade off between speed and accuracy. If the baud rate increases, some data may be accidentally skipped over.
Discussion
My biggest challenge for this lab was learning the nuances of the interactions between all the softwares we will be using in this class. As someone who had never used the terminal of their computer before, the learning curve has been pretty large over the last week. However, after completing this lab, I am now feeling much more comfortable with the format of Arduino, Jupyter notebook, and Github.